 QtiPlot and Flamory
Flamory provides the following integration abilities:
- Create and use window snapshots for QtiPlot
- Take and edit QtiPlot screenshots
- Automatically copy selected text from QtiPlot and save it to Flamory history
To automate your day-to-day QtiPlot tasks, use the Nekton automation platform. Describe your workflow in plain language, and get it automated using AI.
Screenshot editing
Flamory helps you capture and store screenshots from QtiPlot by pressing a single hotkey. It will be saved to a history, so you can continue doing your tasks without interruptions. Later, you can edit the screenshot: crop, resize, add labels and highlights. After that, you can paste the screenshot into any other document or e-mail message.
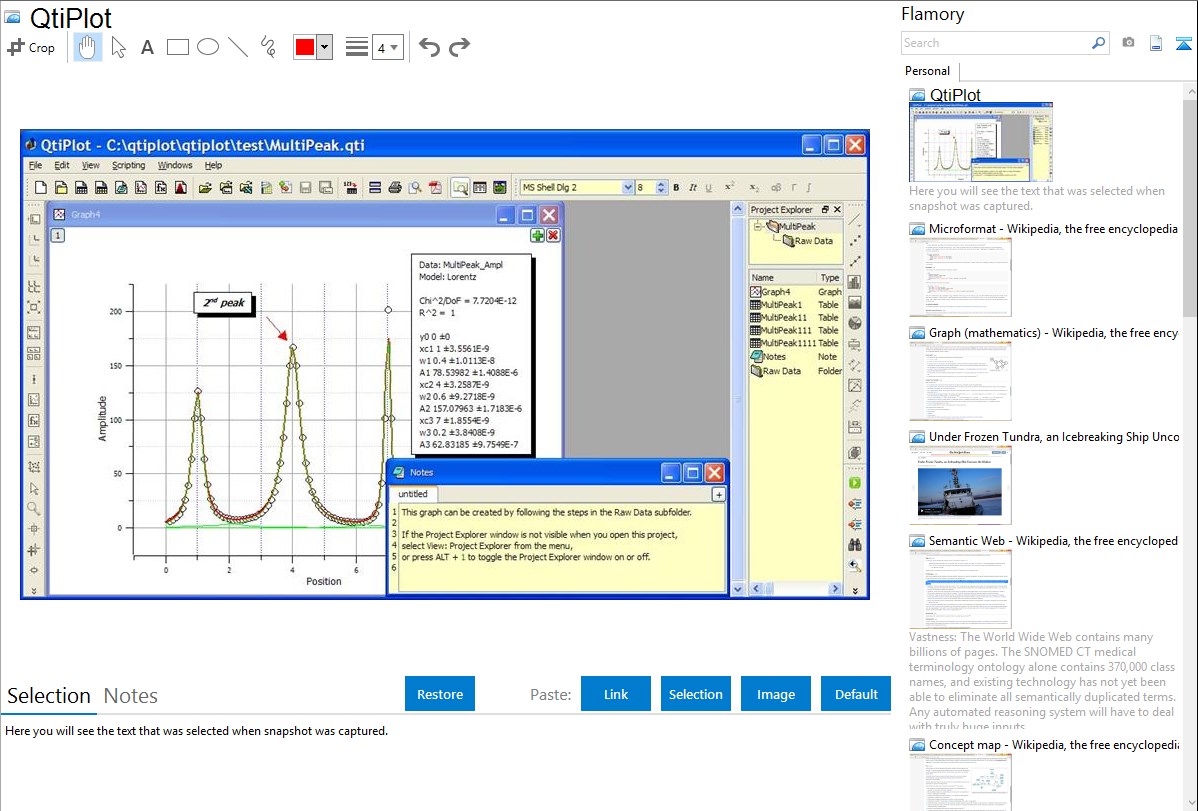
Here is how QtiPlot snapshot can look like. Get Flamory and try this on your computer.
Application info
QtiPlot is a professional scientific data analysis and visualisation solution. It is meant to be a cheap alternative to proprietary and costly software such as Origin, SigmaPlot, Regressi or Igor Pro.
Precompiled binaries are available for a very low price, making this software easily accessible for students ; the source code is freely downloadable, but compilation might be a little tricky. Precompiled packages are also available in some Linux distributions for free.
QtiPlot is used for teaching as well as for complex data analysis and visualisation in companies, high schools, universities and reseach institutes all over the world.
Features:
* Cross-platform: works natively on Windows, Mac OS X and Linux/Unix systems
* Fully Python scriptable
* OpenGL based 3D plotting
* Publication quality plots and easy export to various image formats (EMF, EPS, PS, PDF, SVG, BMP, JPG, PNG, TIFF, etc ...)
* Easy integration with LaTeX typesetting system
* Powerful and versatile spreadsheets with column-logic calculations and easy import/export of multiple files
* One-click access to extensive built-in data analysis routines
* Linear and nonlinear curve fitting with weighting and estimation of statistical errors of the fit-parameters
* Multi-peak fitting
* Image analysis tools
* Templates support: all settings for plots, tables and matrices can be saved and restored later on for a fast editing process
* Project files based on folders, a powerful project explorer with built-in drag and drop and searching facilities
* Full import of OriginLab® Origin projects, Excel workbooks and Open Document Format spreadsheets
Integration level may vary depending on the application version and other factors. Make sure that user are using recent version of QtiPlot. Please contact us if you have different integration experience.