 Stock Spy and Flamory
Flamory provides the following integration abilities:
- Create and use window snapshots for Stock Spy
- Take and edit Stock Spy screenshots
- Automatically copy selected text from Stock Spy and save it to Flamory history
To automate your day-to-day Stock Spy tasks, use the Nekton automation platform. Describe your workflow in plain language, and get it automated using AI.
Screenshot editing
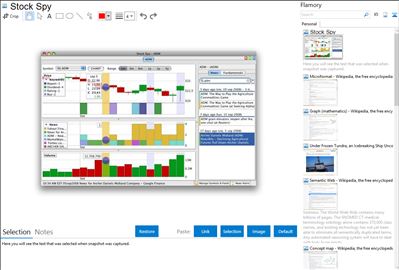
Flamory helps you capture and store screenshots from Stock Spy by pressing a single hotkey. It will be saved to a history, so you can continue doing your tasks without interruptions. Later, you can edit the screenshot: crop, resize, add labels and highlights. After that, you can paste the screenshot into any other document or e-mail message.
Here is how Stock Spy snapshot can look like. Get Flamory and try this on your computer.

Application info
NEWS FLASH - Stock News is packed with opportunities for HUGE profits
Top money managers and hedge funds realize the importance of stock news. But most investors are missing out on opportunities to make phenomenal profit from the news. Or even worse, they can't track the news in their current investments! The reason investors don't take advantage of the news is obvious - It's too hard! It can be very difficult to keep up to date and understand the importance of the news. Once you Try Stock Spy we think you'll agree that it's a groundbreaking investor tool which unleashes the potential hidden within stock news. Stock Spy enables you to easily visualize and pinpoint important company events directly on a stock chart to make smart investment decisions, faster! You can quickly see where a stock has been, where it's going and why. It gives you the edge, whether you are a professional trader, an individual investor or brand new to the stock market. Identify a Killer Trend in the Making. Stock Spy's unique NewsChart technology makes it easy to see correlations between stock news and stock price activity directly on the stock chart . This is extremely useful for finding catalysts for short and long term trends. "Cause-and-effect" analysis is literally dead easy when you see the news plotted together with the stock price. This means it's easy to quickly bring yourself up to speed on what is happening in a new potential investment. Researching and analyzing stocks is boiled down to a simple procedure of clicking and selecting dates which catch your attention by simply glancing at the chart (For example: days with higher than average news volume, trading volume, or which immediately preceded a substantial price move). Once you visually select the dates on your screen, relevant headlines are instantly displayed for your selection. Then, if you want to get more in-depth information, you can click headlines in the "News" tab to directly access the source news article with your web browser
Integration level may vary depending on the application version and other factors. Make sure that user are using recent version of Stock Spy. Please contact us if you have different integration experience.